生成服务图
本次任务说明如何在istio网格中生成服务图,作为本次任务的一部分,我们会安装servicegraph插件并使用基于web的界面查看网格的服务图
在开始之前
- 正确安装istio
- 正确安装bookinfo示例程序
暴露servicegraph服务
1.使用nodePort暴露
# kubectl get svc -n istio-system servicegraph
NAME           TYPE       CLUSTER-IP     EXTERNAL-IP   PORT(S)         AGE
servicegraph   NodePort   10.254.35.68   <none>        8088:8088/TCP   10d
2.使用istio暴露服务
/force/forcegraph.html一个交互式的D3.js 界面./dotviz静态的 Graphviz 可视化界面./dotgraph提供 DOT 序列化./d3graph为D3可视化提供JSON序列化/graph提供通用的JSON序列化
# istioctl get   virtualservice jaeger -o yaml
apiVersion: networking.istio.io/v1alpha3
kind: VirtualService
metadata:
  creationTimestamp: null
  name: jaeger
  namespace: default
  resourceVersion: "1150555"
spec:
  gateways:
  - bookinfo-gateway
  hosts:
  - jaeger.example.com
  http:
  - match:
    - uri:
        prefix: /force
    - uri:
        prefix: /dotviz
    - uri:
        prefix: /dotgraph
    - uri:
        prefix: /d3graph
    - uri:
        prefix: /graph
    - uri:
        prefix: /js
    route:
    - destination:
        host: servicegraph.istio-system.svc.cluster.local
        port:
          number: 8088
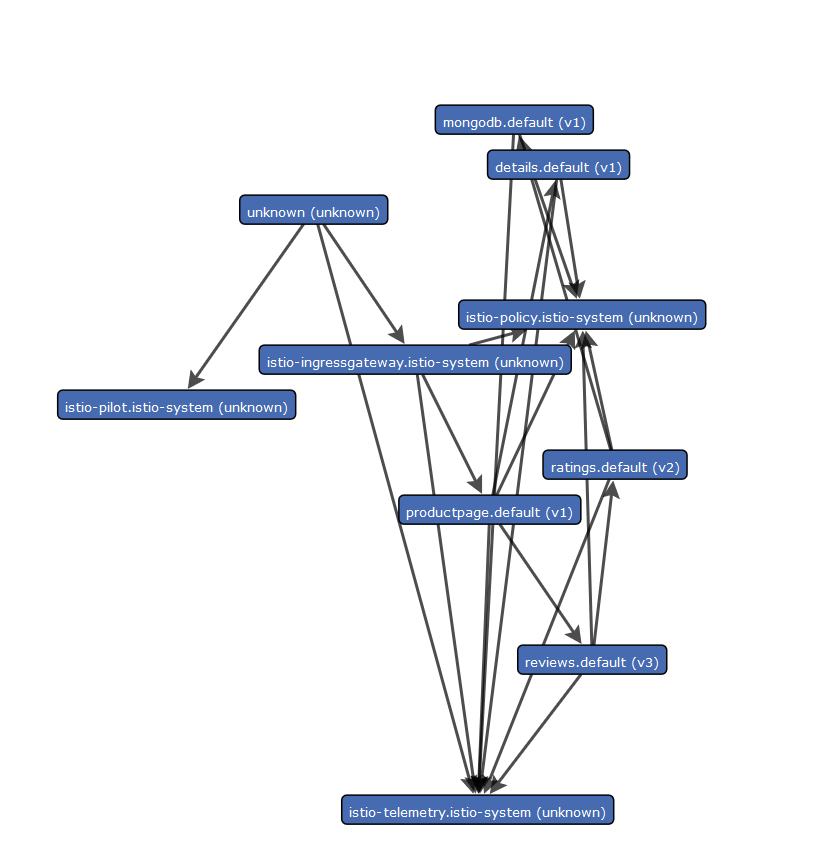
查询http://YOURDOMAIN/force/forcegraph.html可以看到如下页面
通过查询参数,可以添加一定的过滤条件,请求<http://YOURDOMAIN/force/forcegraph.html?time_horizon=15s&filter_empty=true 添加filter_empty=true参数,将会显示当前时间范围内的接收的流量服务,time_horizon=15s影响之前的过滤器,并且会影响查看时的流量报告信息